
Spring Boot Startup and Memory Tuning: CDS and AOT Cache
Introduction
A Spring Boot application that takes several seconds to start and a few hundred megabytes to run is fine on a server that is started once a month. It is less fine on a platform that starts and stops instances all day - scaling up under load, rolling out a new version, restarting a failed container - and bills for every megabyte. Much of that time and memory can be recovered without changing a line of application code. In this tutorial we take one application and measure its startup in six configurations: the plain jar, the extracted jar, with a CDS archive, with the AOT cache of JDK 25, with Spring's AOT processing, and with both together. We then look at lazy initialization, at where the JVM's memory goes and how to limit it, and at what virtual threads change. Every number shown is measured, on Spring Boot 4.1.2 and JDK 25.Where the startup time goes
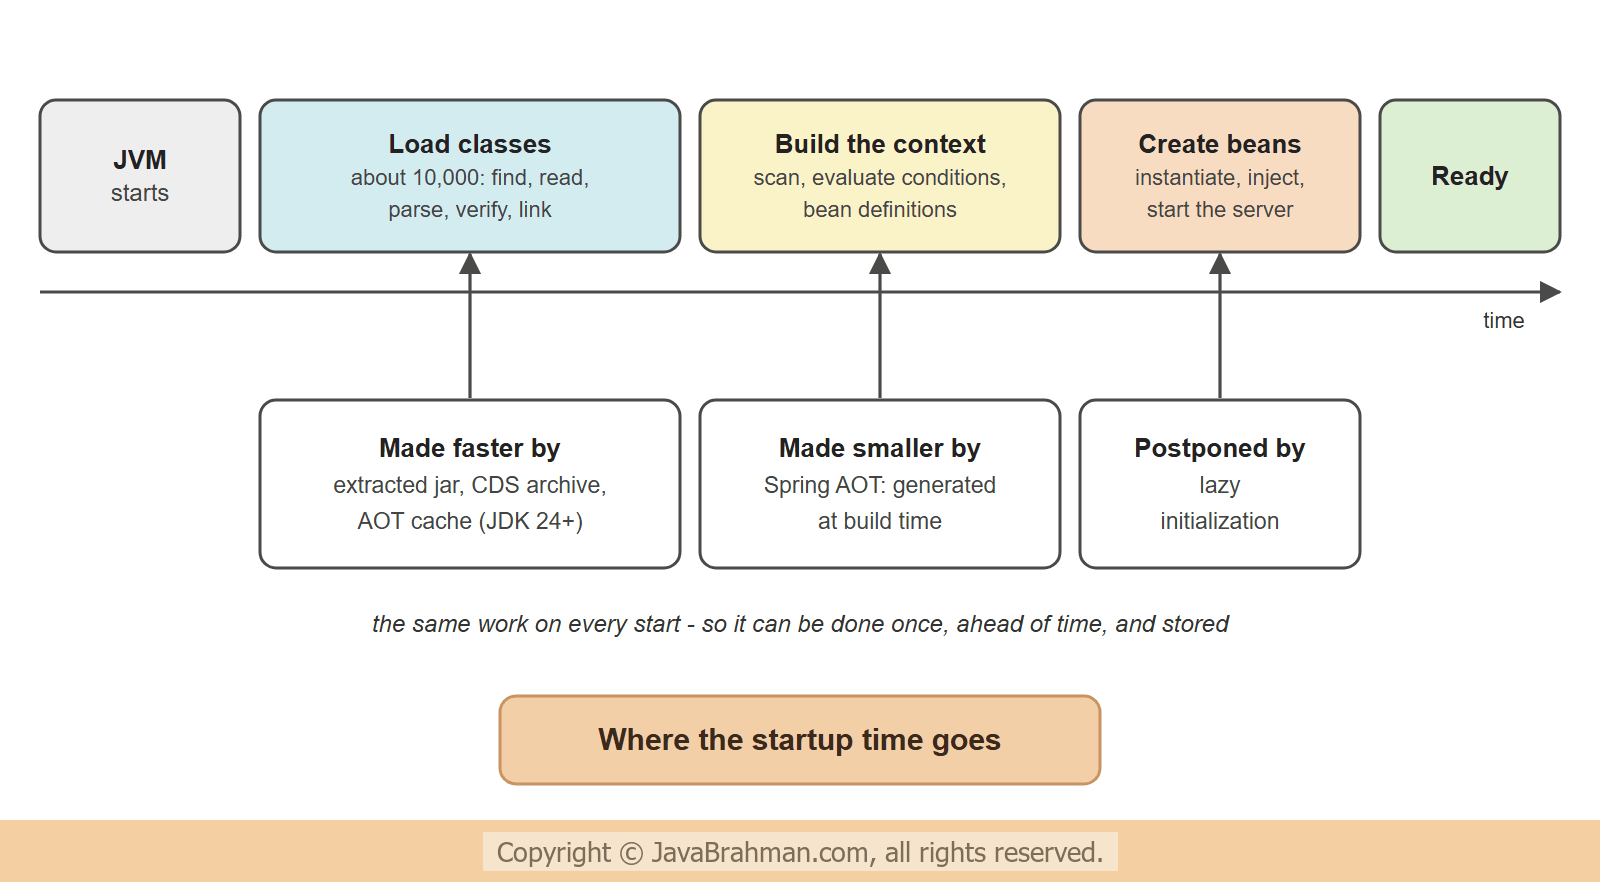 A Spring Boot application does little of its own work while starting. Most of the time goes into two things that are the same on every start -
- Loading classes - an ordinary Spring Boot web application loads around ten thousand classes. Each has to be found in a jar, read, parsed, verified and linked, and its code starts out interpreted.
- Building the application context - Spring scans the classpath for components, evaluates the conditions of some hundred auto-configurationsClick to read tutorial: How Spring Boot Auto-Configuration Works, works out the bean definitions, and creates the beans.
The application and how it is measured
The application is a small but typical service: Spring Web MVC, Actuator, Spring Data JDBC, validation and an H2 database.BookController.java
//BookController.java
package com.javabrahman.spring.tuning;

import java.util.List;
import org.springframework.jdbc.core.simple.JdbcClient;
import org.springframework.web.bind.annotation.GetMapping;
import org.springframework.web.bind.annotation.RestController;

@RestController
public class BookController {

  public record Book(String isbn, String title) {
  }

  private final JdbcClient jdbc;

  BookController(JdbcClient jdbc) {
    this.jdbc = jdbc;
  }

  @GetMapping("/books")
  public List<Book> books() {
    return jdbc.sql("select isbn, title from books order by isbn").query(Book.class).list();
  }

  // a request that waits two seconds, as a call to a slow database or remote service would
  @GetMapping("/slow")
  public String slow() throws InterruptedException {
    Thread.sleep(2000);
    return "done on " + (Thread.currentThread().isVirtual() ? "a virtual thread" : "a platform thread");
  }
}
ReadyReporter.java
//ReadyReporter.java
package com.javabrahman.spring.tuning;

import java.lang.management.ManagementFactory;
import org.springframework.beans.factory.annotation.Value;
import org.springframework.boot.context.event.ApplicationReadyEvent;
import org.springframework.context.event.EventListener;
import org.springframework.stereotype.Component;

@Component
public class ReadyReporter {

  private final boolean exitWhenReady;

  ReadyReporter(@Value("${app.exit-when-ready:false}") boolean exitWhenReady) {
    this.exitWhenReady = exitWhenReady;
  }

  @EventListener(ApplicationReadyEvent.class)
  void ready() {
    long uptime = ManagementFactory.getRuntimeMXBean().getUptime();
    int classes = ManagementFactory.getClassLoadingMXBean().getLoadedClassCount();
    System.out.println("ready " + uptime + " ms after JVM start, " + classes + " classes loaded");
    if (exitWhenReady) {
      System.exit(0);
    }
  }
}ReadyReporterlistens for theApplicationReadyEvent, which Spring Boot publishes when the application can serve requests. It prints the JVM's uptime at that moment - the time since thejavaprocess started, so that JVM startup is included - and the number of classes loaded.- With
app.exit-when-ready=truethe application then exits. The measuring script sets this through an environment variable, starts the application six times, discards the first start, and prints the other five and their median. - The numbers are from one developer laptop. Yours will be different, quite possibly much lower. What carries over is the proportion between the configurations.
1. The baseline: the executable jar
OUTPUT: five starts of the executable jar> java -jar app.jar ready after 7029, 7411, 7621, 7322, 7028 ms median 7322 ms, 10319 classes loaded
mvn package, with all its libraries nested inside as jars within the jar.
2. Extracting the jar
Reading classes from jars that are nested in another jar is slower than reading them from jars on the disk, and the techniques that follow do not work with nested jars at all. Spring Boot can unpack its own jar -java -Djarmode=tools -jar app.jar extract --destination extracted
app.jar
lib
app.jar that contains only the application's own classes, and a lib directory with the libraries as ordinary jar files, which the small jar refers to in its manifest. It is started the same way.
OUTPUT: five starts of the extracted jar> java -jar extracted\app.jar ready after 6169, 6478, 6186, 6754, 6120 ms median 6186 ms, 10178 classes loaded
3. Class Data Sharing (CDS)
Class Data Sharing stores classes in the form the JVM uses internally, after reading, parsing and partly verifying them, in an archive file. A later start maps the file into memory and skips that work. The JDK has used a CDS archive for its own classes for years; application CDS extends it to the classes of the application and its libraries. It takes two steps -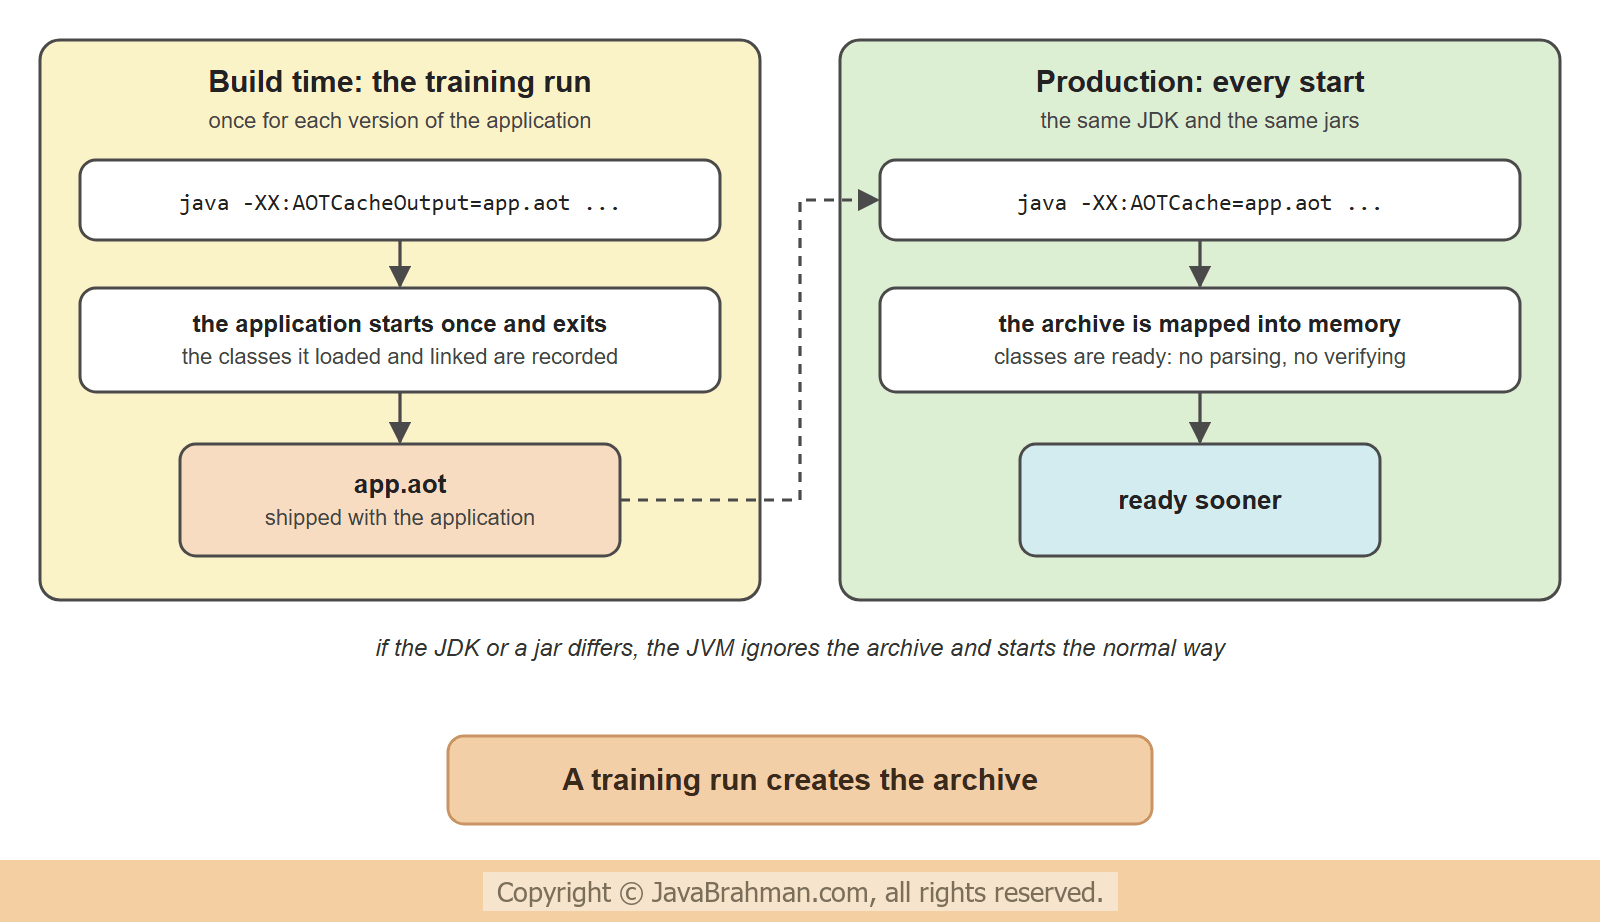
# 1. a training run that writes the archive when the application exits
java -XX:ArchiveClassesAtExit=app.jsa -Dspring.context.exit=onRefresh -jar extracted\app.jar

# 2. every later start uses it
java -XX:SharedArchiveFile=app.jsa -jar extracted\app.jar
-XX:ArchiveClassesAtExitmakes the JVM record the classes it loaded and write them toapp.jsaon exit.-Dspring.context.exit=onRefreshis Spring's part: the application starts completely - all beans created - and then exits at once, without serving a request. That is exactly the set of classes a start needs.- During the training run the JVM prints warnings about some classes that it cannot archive. They can be ignored; those classes are simply loaded the normal way.
> java -XX:SharedArchiveFile=app.jsa -jar extracted\app.jar
ready after 4075, 4385, 4032, 4047, 3921 ms
median 4047 ms, 10041 classes loaded
4. The AOT cache of JDK 24 and 25
JDK 24 introduced the AOT cache (ahead-of-time cache), the successor of the CDS archive. It goes a step further: the classes are stored not only parsed but already loaded and linked, and since JDK 25 the cache also contains the profiles that the JIT compiler collected during the training run, so that the application reaches its full speed sooner after the start. JDK 25 also reduced the creation to one command -# 1. the training run java -XX:AOTCacheOutput=app.aot -Dspring.context.exit=onRefresh -jar extracted\app.jar # 2. every later start java -XX:AOTCache=app.aot -jar extracted\app.jar
> java -XX:AOTCache=app.aot -jar extracted\app.jar
ready after 3008, 3119, 3044, 3045, 3097 ms
median 3045 ms, 10590 classes loaded
app.jsa - 50790400 bytes
app.aot - 73596928 bytes
5. Spring AOT
CDS and the AOT cache shorten class loading. They do nothing about the second cost, the building of the application context. That is the target of Spring AOT, which despite the similar name is a different thing: a step of the build, run by the Spring Boot plugin. It starts the context far enough to know which beans the application will have, and generates Java source code that registers exactly those beans. At run time the application uses the generated code instead of scanning the classpath and evaluating conditions.pom.xml - the process-aot goal, here in a profile
<plugin>
  <groupId>org.springframework.boot</groupId>
  <artifactId>spring-boot-maven-plugin</artifactId>
  <executions>
    <execution>
      <id>process-aot</id>
      <goals>
        <goal>process-aot</goal>
      </goals>
    </execution>
  </executions>
</plugin>BOOT-INF/classes/com/javabrahman/ BOOT-INF/classes/com/javabrahman/spring/ BOOT-INF/classes/com/javabrahman/spring/tuning/ BOOT-INF/classes/com/javabrahman/spring/tuning/BookController$Book.class BOOT-INF/classes/com/javabrahman/spring/tuning/BookController.class BOOT-INF/classes/com/javabrahman/spring/tuning/BookController__BeanDefinitions.class BOOT-INF/classes/com/javabrahman/spring/tuning/LoadRunner.class BOOT-INF/classes/com/javabrahman/spring/tuning/ReadyReporter.class BOOT-INF/classes/com/javabrahman/spring/tuning/ReadyReporter__BeanDefinitions.class BOOT-INF/classes/com/javabrahman/spring/tuning/TuningApp.class BOOT-INF/classes/com/javabrahman/spring/tuning/TuningApp__ApplicationContextInitializer.class BOOT-INF/classes/com/javabrahman/spring/tuning/TuningApp__BeanDefinitions.class BOOT-INF/classes/com/javabrahman/spring/tuning/TuningApp__BeanFactoryRegistrations.class
BookController__BeanDefinitions, and TuningApp__ApplicationContextInitializer puts them together. The generated code is only used when the application is told so -
OUTPUT: five starts with Spring AOT> java -Dspring.aot.enabled=true -jar extracted-aot\app-aot.jar ready after 4977, 5457, 5020, 4856, 4827 ms median 4977 ms, 10100 classes loaded
@Conditional beans exist, is fixed in the generated code. Property values can still differ per environment, but a bean that exists only when a property is set, or only in one profile, must be decided when building. Applications that rely on such switches at run time need care; many do not.
6. Spring AOT and the AOT cache together
The two address different parts of the start, so they add up. The training run is made with Spring AOT switched on -java -Dspring.aot.enabled=true -XX:AOTCacheOutput=app-aot.aot -Dspring.context.exit=onRefresh -jar extracted-aot\app-aot.jar
> java -Dspring.aot.enabled=true -XX:AOTCache=app-aot.aot -jar extracted-aot\app-aot.jar
ready after 2327, 2252, 2317, 2320, 2278 ms
median 2317 ms, 10476 classes loaded
Lazy initialization
One more switch is often suggested for startup time - OUTPUT: five starts with lazy initialization (extracted jar, no archive)> java -Dspring.main.lazy-initialization=true -jar extracted\app.jar ready after 5877, 5881, 5683, 5680, 5530 ms median 5683 ms, 9027 classes loaded
spring.main.lazy-initialization=true a bean is created when it is first needed, not at startup; the lower number of loaded classes shows that work was left out. But the work is not saved, only moved: the first requests pay for it, and so are slow. And a misconfigured bean no longer stops the application from starting - it fails later, on the first request that needs it, in production. Lazy initialization is useful during development, where restarts are frequent. For production the techniques above are better: they make the same work faster instead of hiding it.
Where the memory goes
The memory of a Java process is much more than the heap, and a container is killed when the whole process exceeds its limit, not when the heap is full.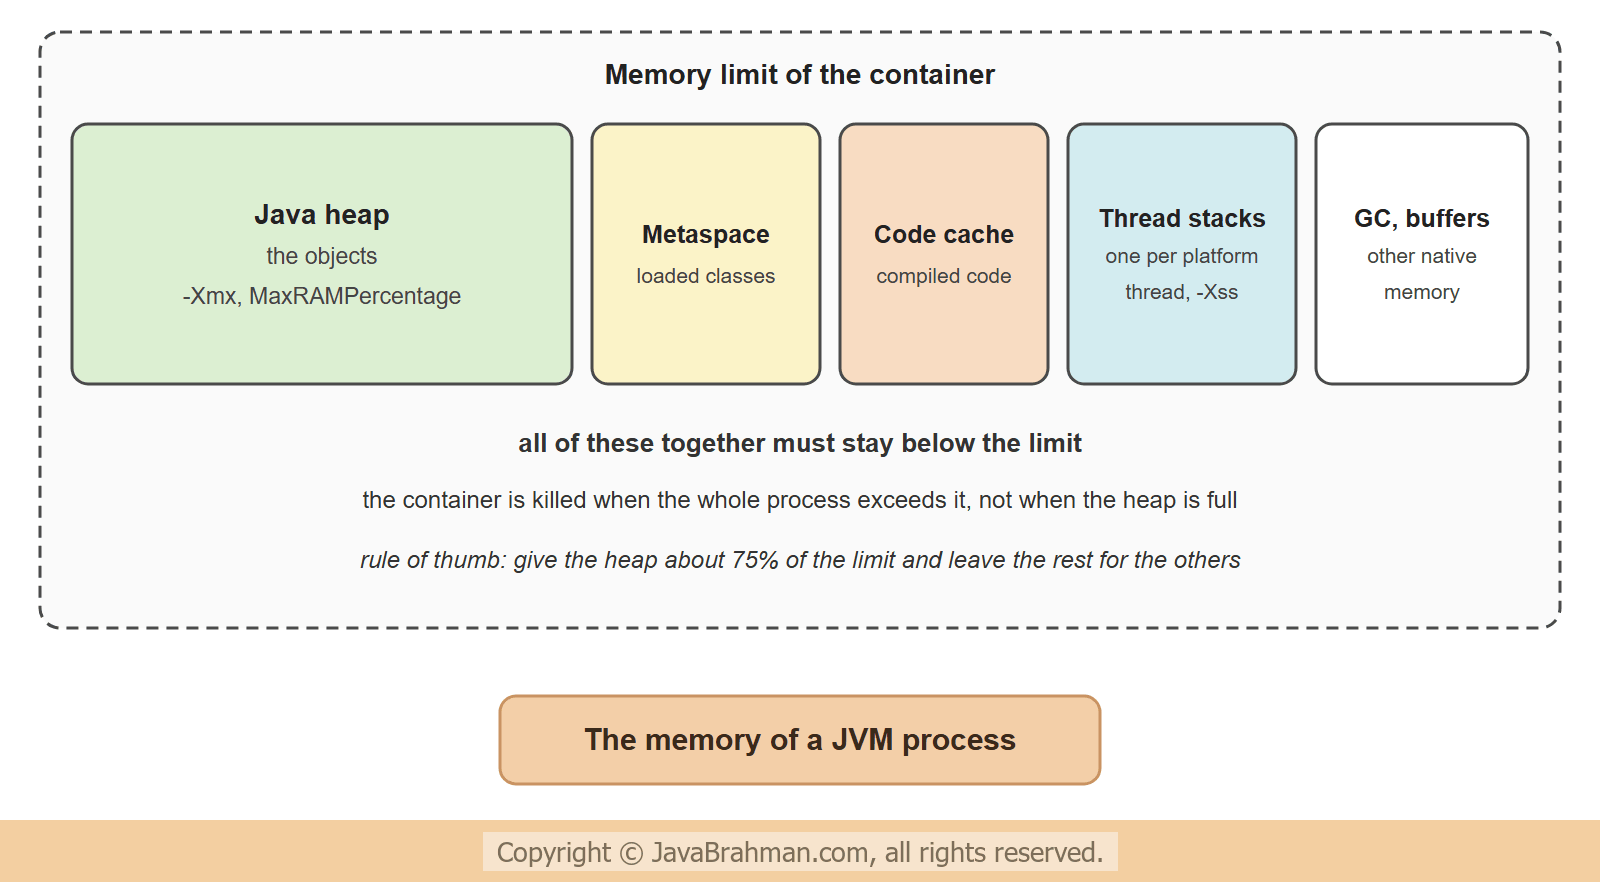 The JVM can report all of these areas. Native Memory Tracking is switched on with a flag, and
jcmd asks a running JVM for the summary. The following shows the main lines for the example application, started with no memory settings at all.
OUTPUT: java -XX:NativeMemoryTracking=summary -jar app.jar (main lines of the summary)> jcmd <pid> VM.native_memory summary Total: reserved=9945499KB, committed=226979KB - Java Heap (reserved=8278016KB, committed=69632KB) - Class (reserved=1049378KB, committed=7202KB) - Thread (reserved=49295KB, committed=2639KB) - Code (reserved=254538KB, committed=21506KB) - GC (reserved=216817KB, committed=56449KB) - GCCardSet (reserved=6KB, committed=6KB) - Metaspace (reserved=65722KB, committed=40058KB)
- Reserved is address space the JVM has set aside; committed is memory it is actually using. Committed is what counts against a container's limit.
- Java Heap - with no
-Xmx, the maximum heap is a quarter of the machine's (or the container's) memory. That is the large reserved figure. Only a small part is committed just after startup; the heap grows under load, up to the maximum. - Class and Metaspace hold the loaded classes - tens of megabytes for the ten thousand classes of a Spring Boot application, whatever the heap size.
- Thread - every platform thread reserves a stack, 1 MB by default on most systems. The application has only a few dozen threads at this point; Tomcat creates up to 200 more under load.
- Code is the cache of compiled code, and GC is what the garbage collector needs for its own bookkeeping. With the default collector, G1, that grows with the heap.
> jcmd <pid> VM.native_memory summary
Total: reserved=1684475KB, committed=165959KB
-                 Java Heap (reserved=262144KB, committed=65600KB)
-                     Class (reserved=1049440KB, committed=7264KB)
-                    Thread (reserved=20073KB, committed=2301KB)
-                      Code (reserved=254555KB, committed=21071KB)
-                        GC (reserved=918KB, committed=282KB)
-                 Metaspace (reserved=65723KB, committed=40059KB)
-Xmx256mlimits the heap to 256 MB, and the reserved heap shows it. In a container,-XX:MaxRAMPercentage=75is usually the better way to say it: the heap is then a share of whatever limit the container has, and the remaining quarter is left for everything else in the list.-Xss512khalves the stack of each thread; the reserved thread memory drops accordingly.-XX:+UseSerialGCselects the simplest collector, whose own memory is almost nothing. For heaps of a few hundred megabytes and one or two CPUs it is a reasonable choice, and it is what the JVM picks by itself on such a small machine. On large heaps, stay with G1.
mvn spring-boot:build-image) contains a memory calculator that sets them at startup from the container's limit and the number of classes.
Virtual threads
The thread stacks lead to the last setting. With the classic model, each request that is being handled occupies one platform thread, also while it only waits for a database or another service. Tomcat's pool has 200 such threads by default; request number 201 has to queue. With one property,spring.threads.virtual.enabled=true, Spring Boot handles every request on a virtual thread, which costs a few kilobytes instead of a megabyte and gives up its carrier thread while it waits. The tutorial on @Async and virtual threadsClick to read tutorial: Async Processing in Spring with @Async and Virtual Threads explains them.
The example application has an endpoint /slow that sleeps for two seconds, as a slow query or a slow remote service would. With the profile load, the application sends 600 requests to it at the same moment and reports.
LoadRunner.java
//LoadRunner.java
package com.javabrahman.spring.tuning;

import java.lang.management.ManagementFactory;
import java.net.URI;
import java.net.http.HttpClient;
import java.net.http.HttpRequest;
import java.net.http.HttpResponse;
import java.util.concurrent.Executors;
import java.util.concurrent.atomic.AtomicInteger;
import org.springframework.boot.context.event.ApplicationReadyEvent;
import org.springframework.context.annotation.Profile;
import org.springframework.context.event.EventListener;
import org.springframework.stereotype.Component;

// With the profile "load": sends 600 simultaneous requests to /slow and reports how long they took together.
@Component
@Profile("load")
public class LoadRunner {

  @EventListener(ApplicationReadyEvent.class)
  void run() throws Exception {
    HttpClient client = HttpClient.newBuilder().executor(Executors.newVirtualThreadPerTaskExecutor()).build();
    HttpRequest request = HttpRequest.newBuilder(URI.create("http://localhost:8080/slow")).build();
    String first = client.send(request, HttpResponse.BodyHandlers.ofString()).body();
    int before = ManagementFactory.getThreadMXBean().getThreadCount();

    AtomicInteger answered = new AtomicInteger();
    long start = System.nanoTime();
    try (var executor = Executors.newVirtualThreadPerTaskExecutor()) {
      for (int i = 0; i < 600; i++) {
        executor.submit(() -> {
          client.send(request, HttpResponse.BodyHandlers.ofString());
          return answered.incrementAndGet();
        });
      }
    }
    long millis = (System.nanoTime() - start) / 1_000_000;

    System.out.println("a request is " + first);
    System.out.println("600 simultaneous requests of 2 seconds each: " + answered.get() + " answered in " + millis + " ms");
    System.out.println("platform threads: " + before + " before, " + ManagementFactory.getThreadMXBean().getPeakThreadCount() + " at the peak");
    System.exit(0);
  }
}a request is done on a platform thread 600 simultaneous requests of 2 seconds each: 600 answered in 7046 ms platform threads: 31 before, 229 at the peak
a request is done on a virtual thread
600 simultaneous requests of 2 seconds each: 600 answered in 3365 ms
platform threads: 21 before, 30 at the peak
- Platform threads - Tomcat grows its pool to the maximum of 200 threads, which is the rise in the thread count. 600 requests of two seconds each on 200 threads need three rounds, so the run cannot take less than six seconds.
- Virtual threads - all 600 requests are handled at once, and the number of platform threads hardly moves: the 600 virtual threads share a handful of carrier threads. The run takes little more than the two seconds of a single request, with a fraction of the threads and of the stack memory. The time above two seconds is mostly the client opening 600 connections.
Summary
In this tutorial we measured what a Spring Boot application's start costs and how to reduce it without touching its code. Extracting the executable jar made class loading faster; a CDS archive, and better the AOT cache of JDK 24 and 25, stored the loaded classes from a training run so that later starts skip that work; Spring AOT generated the bean definitions at build time; and both together gave the shortest start. Lazy initialization only postpones the work. For memory, Native Memory Tracking showed that a JVM uses far more than its heap - classes, compiled code, thread stacks and the garbage collector's own data - and how-Xmx or MaxRAMPercentage, -Xss and the choice of collector limit it. Finally, spring.threads.virtual.enabled=true let the application handle 600 waiting requests at once with a few dozen platform threads instead of more than two hundred.