
Spring Boot Actuator: Health, Metrics and Info
Introduction
An application that runs in production gets asked questions that its business endpoints cannot answer. Is it up, and can it reach its database? Which version is this? How many requests does it handle, and how long do they take? Can somebody switch one package to DEBUG logging without a restart? Spring Boot Actuator adds a set of ready-made endpoints that answer such questions, over HTTP or JMX, to any Spring Boot application. In this tutorial we add Actuator to a small service and look at what is exposed by default and why, at health checks including a custom one and the probes Kubernetes uses, at the info endpoint, at metrics with Micrometer including a counter of our own, at changing log levels at runtime, at writing a custom endpoint, and at keeping all of this away from the public. The code runs on Spring Boot 4.1.2.What Actuator provides
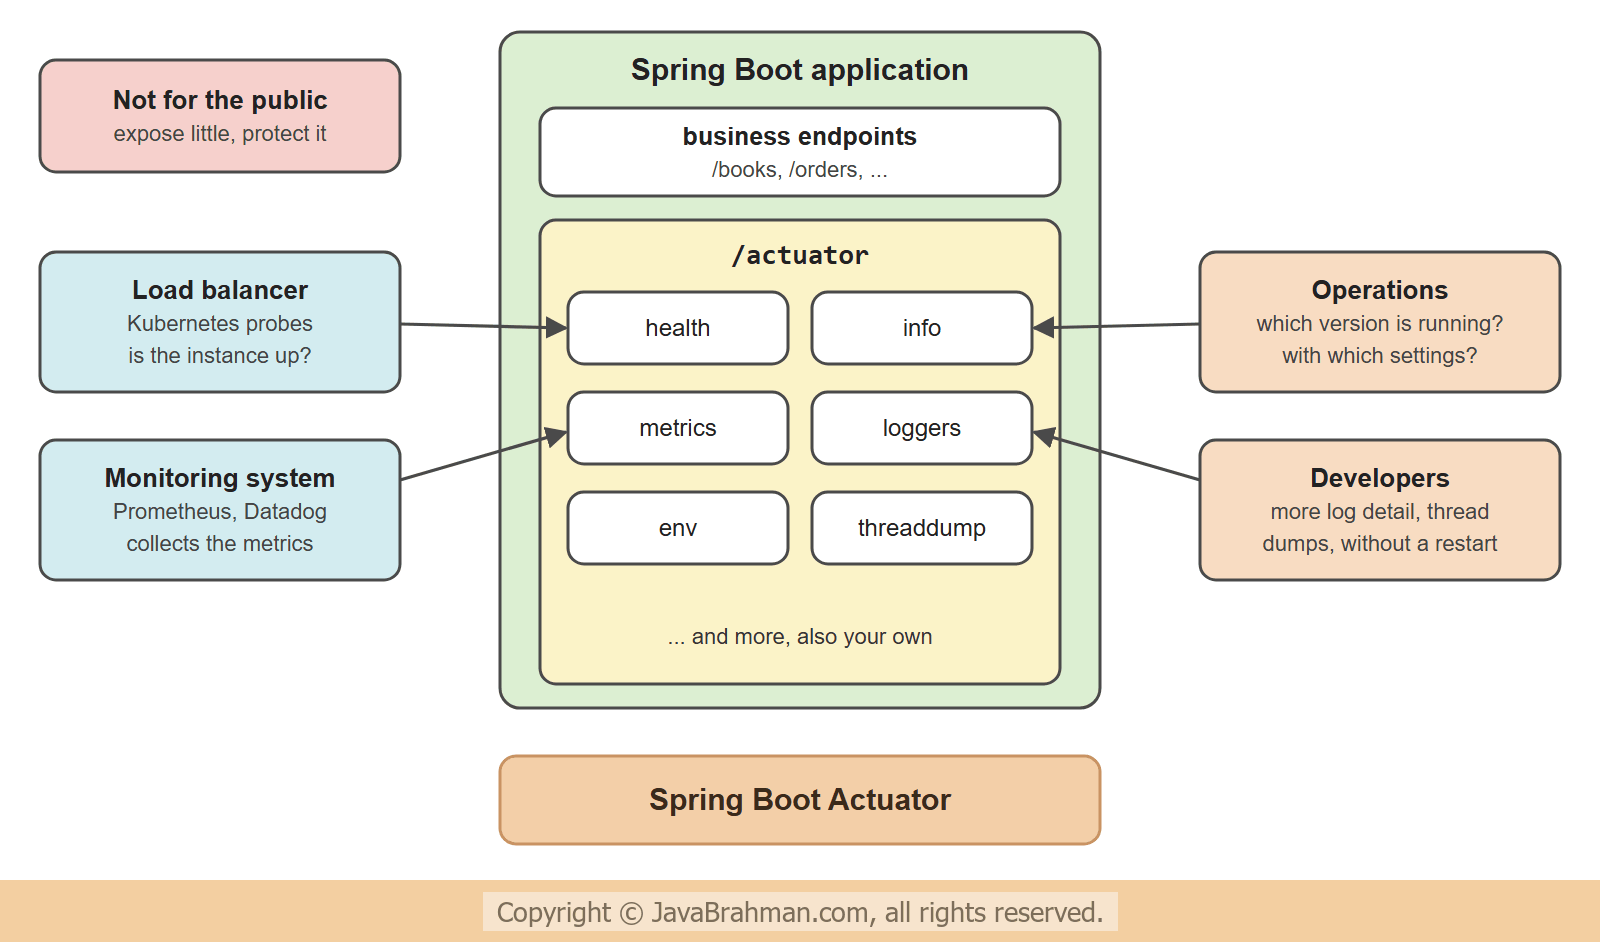 Actuator is one dependency,
spring-boot-starter-actuator. With it, the application gets endpoints under the path /actuator. The ones used most are -
health- is the application, and what it depends on, working?info- general information: name, version, build, Java runtime.metrics- numbers measured inside the application: requests, memory, threads, connection pools, and your own.loggers- shows and changes log levels while the application runs.env,configprops,beans,mappings,conditions- what the application was configured with: properties, beans, request mappings, and why each auto-configurationClick to read tutorial: How Spring Boot Auto-Configuration Works applied or did not.threaddump,heapdump,scheduledtasks,caches,prometheus- for diagnosis and monitoring.
The defaults
The example is a small book service. Its controller already contains two things that will be used later: a counter and a debug log statement.src/main/resources/application.properties
spring.application.name=book-serviceBookApp.java
//BookApp.java
package com.javabrahman.spring.actuator;

import org.springframework.boot.SpringApplication;
import org.springframework.boot.autoconfigure.SpringBootApplication;

@SpringBootApplication
public class BookApp {

  public static void main(String[] args) {
    SpringApplication.run(BookApp.class, args);
  }
}
Book.java
//Book.java
package com.javabrahman.spring.actuator;

public record Book(int id, String title) {
}
BookController.java
//BookController.java
package com.javabrahman.spring.actuator;

import io.micrometer.core.instrument.Counter;
import io.micrometer.core.instrument.MeterRegistry;
import java.util.Map;
import org.slf4j.Logger;
import org.slf4j.LoggerFactory;
import org.springframework.http.HttpStatus;
import org.springframework.web.bind.annotation.GetMapping;
import org.springframework.web.bind.annotation.PathVariable;
import org.springframework.web.bind.annotation.RestController;
import org.springframework.web.server.ResponseStatusException;

@RestController
public class BookController {

  private static final Logger log = LoggerFactory.getLogger(BookController.class);

  private final Map<Integer, String> titles = Map.of(1, "Effective Java", 2, "Clean Code");
  private final Counter viewed;

  BookController(MeterRegistry registry) {
    this.viewed = Counter.builder("books.viewed")
        .description("Number of times a book page was viewed")
        .register(registry);
  }

  @GetMapping("/books/{id}")
  public Book book(@PathVariable int id) {
    log.debug("looking up book {}", id);
    String title = titles.get(id);
    if (title == null) {
      throw new ResponseStatusException(HttpStatus.NOT_FOUND);
    }
    viewed.increment();
    return new Book(id, title);
  }
}> curl -i http://localhost:8080/actuator
HTTP/1.1 200
Content-Length: 243
Content-Type: application/vnd.spring-boot.actuator.v3+json
{"_links":{"self":{"href":"http://localhost:8080/actuator","templated":false},"health-path":{"href":"http://localhost:8080/actuator/health/{*path}","templated":true},"health":{"href":"http://localhost:8080/actuator/health","templated":false}}}
> curl -i http://localhost:8080/actuator/health
HTTP/1.1 200
Content-Type: application/vnd.spring-boot.actuator.v3+json
{"groups":["liveness","readiness"],"status":"UP"}
> curl -i http://localhost:8080/actuator/metrics
HTTP/1.1 404
Content-Type: application/json
{"timestamp":"2026-11-10T13:50:08.523Z","status":404,"error":"Not Found","path":"/actuator/metrics"}
/actuatoris a discovery page: it lists the endpoints that can be called. By default that is onlyhealth./actuator/healthsaysUPand nothing more. No details are shown./actuator/metricsanswers 404, although the metrics are being collected inside the application.
Access and exposure
Two separate settings decide whether an endpoint can be called -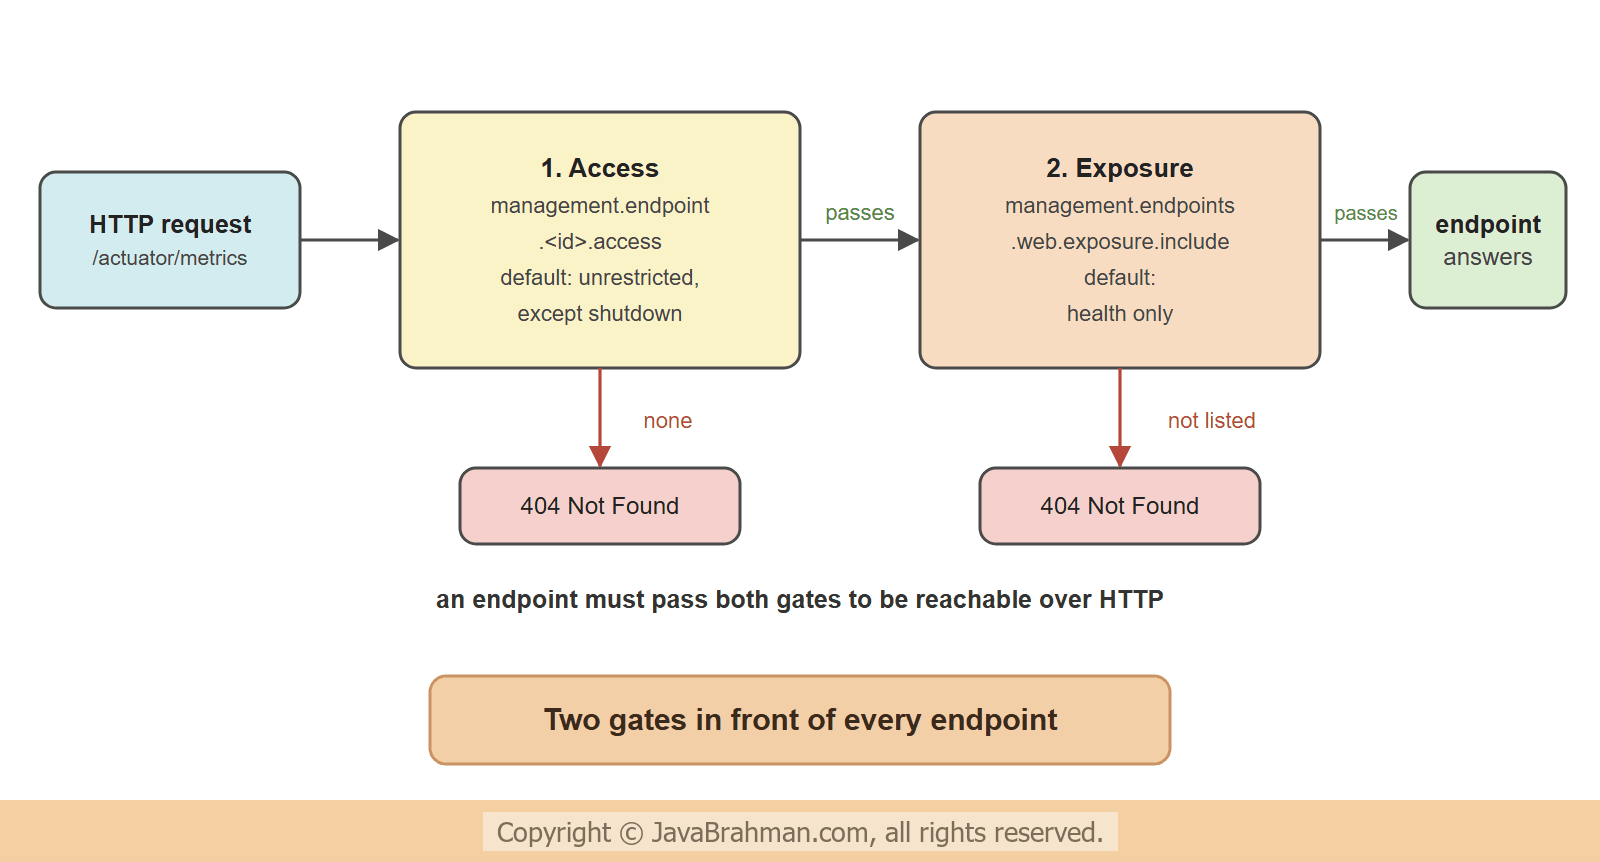
- Access - whether the endpoint exists at all.
management.endpoint.<id>.accesstakesnone,read-onlyorunrestricted. All endpoints are accessible by default, exceptshutdown. - Exposure - whether it is reachable over HTTP.
management.endpoints.web.exposure.includelists the ids; onlyhealthis in it by default.*exposes everything, which is convenient on a developer's machine and a mistake in production.
ops, which exposes four endpoints and a custom one, and sets the properties that the following sections explain.
src/main/resources/application-ops.properties
management.endpoints.web.exposure.include=health,info,metrics,loggers,maintenance

management.endpoint.health.show-details=always
management.health.diskspace.enabled=false
management.endpoint.health.group.readiness.include=readinessState,db,warehouse

management.info.env.enabled=true
management.info.java.enabled=true
info.app.name=book-service
info.app.version=1.4.0
Health
The health endpoint is put together from health indicators. Each one checks one thing and reports a status. Spring Boot adds indicators for what it finds in the application - aDataSource, Redis, a mail server, a message broker, the disk - and an indicator of your own is a bean that implements HealthIndicator. The book service depends on a warehouse system, so it gets one. The warehouse here is a small class that can be switched to "unreachable" with a request, so that a failure can be shown.
Warehouse.java
//Warehouse.java
package com.javabrahman.spring.actuator;

import org.springframework.web.bind.annotation.PathVariable;
import org.springframework.web.bind.annotation.PostMapping;
import org.springframework.web.bind.annotation.RestController;

// Stands in for a remote warehouse system; POST /warehouse/down makes it unreachable.
@RestController
public class Warehouse {

  private volatile boolean reachable = true;

  @PostMapping("/warehouse/{state}")
  public String set(@PathVariable String state) {
    reachable = state.equals("up");
    return "warehouse is " + state;
  }

  public int pendingShipments() {
    if (!reachable) {
      throw new IllegalStateException("connection refused");
    }
    return 12;
  }
}
WarehouseHealthIndicator.java
//WarehouseHealthIndicator.java
package com.javabrahman.spring.actuator;

import org.springframework.boot.health.contributor.Health;
import org.springframework.boot.health.contributor.HealthIndicator;
import org.springframework.stereotype.Component;

@Component
public class WarehouseHealthIndicator implements HealthIndicator {

  private final Warehouse warehouse;

  WarehouseHealthIndicator(Warehouse warehouse) {
    this.warehouse = warehouse;
  }

  @Override
  public Health health() {
    try {
      return Health.up().withDetail("pendingShipments", warehouse.pendingShipments()).build();
    } catch (RuntimeException e) {
      return Health.down().withDetail("error", e.getMessage()).build();
    }
  }
}FeatureInfoContributor.java
//FeatureInfoContributor.java
package com.javabrahman.spring.actuator;

import java.util.LinkedHashMap;
import java.util.Map;
import org.springframework.boot.actuate.info.Info;
import org.springframework.boot.actuate.info.InfoContributor;
import org.springframework.stereotype.Component;

@Component
public class FeatureInfoContributor implements InfoContributor {

  @Override
  public void contribute(Info.Builder builder) {
    Map<String, Boolean> features = new LinkedHashMap<>();
    features.put("recommendations", true);
    features.put("giftWrapping", false);
    builder.withDetail("features", features);
  }
}
MaintenanceEndpoint.java - used in the last section
//MaintenanceEndpoint.java
package com.javabrahman.spring.actuator;

import java.util.Map;
import org.springframework.boot.actuate.endpoint.annotation.Endpoint;
import org.springframework.boot.actuate.endpoint.annotation.ReadOperation;
import org.springframework.boot.actuate.endpoint.annotation.WriteOperation;
import org.springframework.stereotype.Component;

@Component
@Endpoint(id = "maintenance")
public class MaintenanceEndpoint {

  private volatile boolean enabled;

  @ReadOperation
  public Map<String, Object> status() {
    return Map.of("maintenanceMode", enabled);
  }

  @WriteOperation
  public Map<String, Object> change(boolean enabled) {
    this.enabled = enabled;
    return status();
  }
}> curl -i http://localhost:8080/actuator/health
HTTP/1.1 200
Content-Type: application/vnd.spring-boot.actuator.v3+json
{"components":{"db":{"details":{"database":"H2","validationQuery":"isValid()"},"status":"UP"},"livenessState":{"status":"UP"},"ping":{"status":"UP"},"readinessState":{"status":"UP"},"ssl":{"details":{"expiringChains":[],"invalidChains":[],"validChains":[]},"status":"UP"},"warehouse":{"details":{"pendingShipments":12},"status":"UP"}},"groups":["liveness","readiness"],"status":"UP"}
> curl -i http://localhost:8080/actuator/info
HTTP/1.1 200
Content-Length: 369
Content-Type: application/vnd.spring-boot.actuator.v3+json
{"app":{"name":"book-service","version":"1.4.0"},"java":{"jvm":{"name":"OpenJDK 64-Bit Server VM","vendor":"Eclipse Adoptium","version":"25.0.5+8-LTS"},"runtime":{"name":"OpenJDK Runtime Environment","version":"25.0.5+8-LTS"},"vendor":{"name":"Eclipse Adoptium","version":"Temurin-25.0.5+8"},"version":"25.0.5"},"features":{"recommendations":true,"giftWrapping":false}}
> curl -i -X POST http://localhost:8080/warehouse/down
HTTP/1.1 200
Content-Length: 17
Content-Type: text/plain; charset=UTF-8
warehouse is down
> curl -i http://localhost:8080/actuator/health
HTTP/1.1 503
Content-Type: application/vnd.spring-boot.actuator.v3+json
{"components":{"db":{"details":{"database":"H2","validationQuery":"isValid()"},"status":"UP"},"livenessState":{"status":"UP"},"ping":{"status":"UP"},"readinessState":{"status":"UP"},"ssl":{"details":{"expiringChains":[],"invalidChains":[],"validChains":[]},"status":"UP"},"warehouse":{"details":{"error":"connection refused"},"status":"DOWN"}},"groups":["liveness","readiness"],"status":"DOWN"}
> curl -i http://localhost:8080/actuator/health/liveness
HTTP/1.1 200
Content-Type: application/vnd.spring-boot.actuator.v3+json
{"status":"UP"}
> curl -i http://localhost:8080/actuator/health/readiness
HTTP/1.1 503
Content-Type: application/vnd.spring-boot.actuator.v3+json
{"components":{"db":{"details":{"database":"H2","validationQuery":"isValid()"},"status":"UP"},"readinessState":{"status":"UP"},"warehouse":{"details":{"error":"connection refused"},"status":"DOWN"}},"status":"DOWN"}
- Health with details - with
show-details=alwaysthe answer lists every component.dbcomes from Spring Boot, which found the H2DataSourceand checks that a connection is valid.warehouseis our indicator, named after the bean without itsHealthIndicatorsuffix, with the detail it added.pingalways answers,sslreports on configured certificates, andlivenessStateandreadinessStateare explained below. The disk space indicator is switched off in the properties only because its details contain a path of the machine the tutorial was written on. - Info - three contributors answered.
appcomes from theinfo.*properties (management.info.env.enabled),javafrommanagement.info.java.enabled, andfeaturesfromFeatureInfoContributor. With the Maven or Gradle plugin's build-info goal and the git-commit-id plugin,buildandgitsections appear as well, which answers "which version is running?" exactly. - One component down - after the warehouse is made unreachable, its indicator reports
DOWN. The overall status is the worst of all components, so it isDOWNtoo, and the HTTP status changes from 200 to 503. That status code is what load balancers and monitors act on; they do not read the body. - Liveness and readiness - the last two requests ask health groups, which are subsets of the indicators. Liveness is still
UP; readiness isDOWN.
Liveness and readiness
A single "is it healthy?" is not enough for a platform that manages the application, because there are two different questions with two different consequences.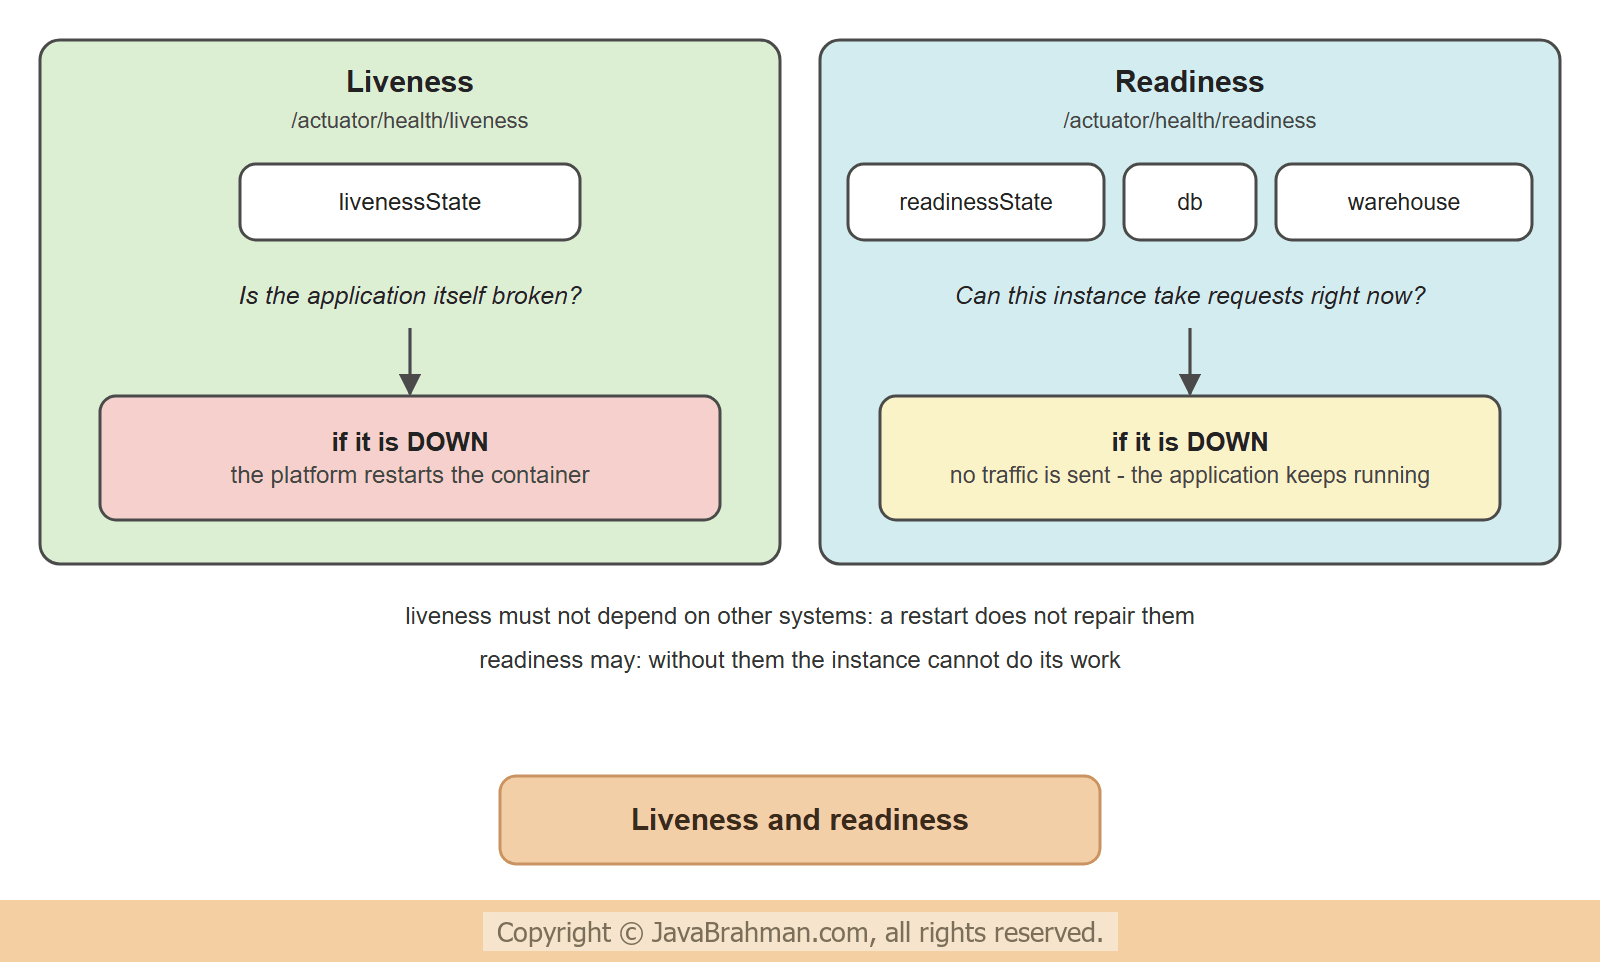
- Liveness - "is this process broken beyond repair?" If the answer is no longer UP, the platform restarts the application. It must therefore not depend on anything outside the application: restarting the book service does not repair the warehouse.
- Readiness - "can this instance handle requests right now?" If not, the platform stops sending it traffic and asks again later. External systems that the application cannot work without belong here.
/actuator/health/liveness and /actuator/health/readiness. By default each contains only the application's own state. The property management.endpoint.health.group.readiness.include=readinessState,db,warehouse adds the database and the warehouse to readiness, which is why the outage above took the instance out of service without marking it for a restart. In Kubernetes these two URLs are the livenessProbe and readinessProbe of the container.
Metrics
Spring Boot measures the application with Micrometer, a library that is to metrics what SLF4J is to logging: the code records numbers through one API, and the numbers can be sent to Prometheus, Datadog, OpenTelemetry and many other systems. Without any code, Spring Boot already records HTTP requests, JVM memory and garbage collection, threads, CPU, the connection pool and more. A metric of your own is registered with theMeterRegistry, as BookController does for the counter books.viewed. The metrics endpoint shows the current values.
OUTPUT: metrics> curl -i http://localhost:8080/books/1
HTTP/1.1 200
Content-Length: 33
Content-Type: application/json
{"id":1,"title":"Effective Java"}
> curl -i http://localhost:8080/books/2
HTTP/1.1 200
Content-Length: 29
Content-Type: application/json
{"id":2,"title":"Clean Code"}
> curl -i http://localhost:8080/books/99
HTTP/1.1 404
Content-Type: application/json
{"timestamp":"2026-11-10T13:50:26.395Z","status":404,"error":"Not Found","path":"/books/99"}
> curl -i http://localhost:8080/actuator/metrics/books.viewed
HTTP/1.1 200
Content-Length: 148
Content-Disposition: inline; filename=f.txt
Content-Type: application/vnd.spring-boot.actuator.v3+json
{"availableTags":[],"description":"Number of times a book page was viewed","measurements":[{"statistic":"COUNT","value":2.0}],"name":"books.viewed"}
> curl -i http://localhost:8080/actuator/metrics/http.server.requests?tag=uri:/books/%7Bid%7D
HTTP/1.1 200
Content-Length: 404
Content-Disposition: inline; filename=f.txt
Content-Type: application/vnd.spring-boot.actuator.v3+json
{"availableTags":[{"tag":"exception","values":["none"]},{"tag":"method","values":["GET"]},{"tag":"error","values":["none"]},{"tag":"outcome","values":["CLIENT_ERROR","SUCCESS"]},{"tag":"status","values":["404","200"]}],"baseUnit":"seconds","measurements":[{"statistic":"COUNT","value":3.0},{"statistic":"TOTAL_TIME","value":0.1865862},{"statistic":"MAX","value":0.1696195}],"name":"http.server.requests"}
> curl -i http://localhost:8080/actuator/metrics/http.server.requests?tag=uri:/books/%7Bid%7D&tag=status:404
HTTP/1.1 200
Content-Length: 354
Content-Disposition: inline; filename=f.txt
Content-Type: application/vnd.spring-boot.actuator.v3+json
{"availableTags":[{"tag":"exception","values":["none"]},{"tag":"method","values":["GET"]},{"tag":"error","values":["none"]},{"tag":"outcome","values":["CLIENT_ERROR"]}],"baseUnit":"seconds","measurements":[{"statistic":"COUNT","value":1.0},{"statistic":"TOTAL_TIME","value":0.0109329},{"statistic":"MAX","value":0.0109329}],"name":"http.server.requests"}
> curl -i http://localhost:8080/actuator/metrics/jvm.memory.used?tag=area:heap
HTTP/1.1 200
Content-Length: 237
Content-Disposition: inline; filename=f.txt
Content-Type: application/vnd.spring-boot.actuator.v3+json
{"availableTags":[{"tag":"id","values":["G1 Survivor Space","G1 Old Gen","G1 Eden Space"]}],"baseUnit":"bytes","description":"The amount of used memory","measurements":[{"statistic":"VALUE","value":3.7817728E7}],"name":"jvm.memory.used"}
> curl -i http://localhost:8080/actuator/metrics
HTTP/1.1 200
Content-Length: 1176
Content-Type: application/vnd.spring-boot.actuator.v3+json
{"names":["application.ready.time","application.started.time","books.viewed","disk.free","disk.total","executor.active","executor.completed","executor.pool.core","executor.pool.max","executor.pool.size","executor.queue.remaining","executor.queued","http.server.requests","http.server.requests.active","jdbc.connections.max","jdbc.connections.min","jvm.buffer.count","jvm.buffer.memory.used","jvm.buffer.total.capacity","jvm.classes.loaded","jvm.classes.loaded.count","jvm.classes.unloaded","jvm.compilation.time","jvm.gc.concurrent.phase.time","jvm.gc.live.data.size","jvm.gc.max.data.size","jvm.gc.memory.allocated","jvm.gc.memory.promoted","jvm.gc.overhead","jvm.gc.pause","jvm.info","jvm.memory.committed","jvm.memory.max","jvm.memory.usage.after.gc","jvm.memory.used","jvm.threads.daemon","jvm.threads.live","jvm.threads.peak","jvm.threads.started","jvm.threads.states","logback.events","process.cpu.time","process.cpu.usage","process.start.time","process.uptime","system.cpu.count","system.cpu.usage","tomcat.sessions.active.current","tomcat.sessions.active.max","tomcat.sessions.alive.max","tomcat.sessions.created","tomcat.sessions.expired","tomcat.sessions.rejected"]}
- Three requests are sent first: two books that exist and one that does not.
books.viewedhas the value 2. The counter is incremented only after the book was found, so the 404 is not counted.http.server.requestsis a timer: for the URI pattern/books/{id}it reports a count of 3, the total time and the longest request. The first request of an application is always the slowest, which is whatMAXshows here.- Metrics have tags, and a tag narrows the numbers down.
availableTagslists what else can be filtered on; addingtag=status:404leaves one request. Note that the tag is the URI pattern, not/books/1and/books/2: a tag with unlimited different values would create unlimited time series. jvm.memory.usedfor the heap is one of the many JVM metrics. Its value is whatever the heap held at that moment./actuator/metricswithout a name lists all metric names, among them our own.
metrics endpoint is for looking at single values by hand. A monitoring system does not use it. It collects all metrics at regular intervals - Prometheus, for example, through the prometheus endpoint that appears when micrometer-registry-prometheus is on the classpath - stores them over time, draws them and raises alerts. Besides Counter and Timer, Micrometer has Gauge for values that go up and down, such as a queue length, and DistributionSummary for sizes.
Changing log levels at runtime, and a custom endpoint
OUTPUT: loggers and a custom endpoint> curl -i http://localhost:8080/actuator/loggers/com.javabrahman.spring.actuator
HTTP/1.1 200
Content-Length: 25
Content-Disposition: inline; filename=f.txt
Content-Type: application/vnd.spring-boot.actuator.v3+json
{"effectiveLevel":"WARN"}
> curl -i -X POST http://localhost:8080/actuator/loggers/com.javabrahman.spring.actuator -H "Content-Type: application/json" -d '{"configuredLevel": "DEBUG"}'
HTTP/1.1 204
> curl -i http://localhost:8080/actuator/loggers/com.javabrahman.spring.actuator
HTTP/1.1 200
Content-Length: 52
Content-Disposition: inline; filename=f.txt
Content-Type: application/vnd.spring-boot.actuator.v3+json
{"configuredLevel":"DEBUG","effectiveLevel":"DEBUG"}
> curl -i http://localhost:8080/books/1
HTTP/1.1 200
Content-Length: 33
Content-Type: application/json
{"id":1,"title":"Effective Java"}
> curl -i http://localhost:8080/actuator/maintenance
HTTP/1.1 200
Content-Length: 25
Content-Type: application/vnd.spring-boot.actuator.v3+json
{"maintenanceMode":false}
> curl -i -X POST http://localhost:8080/actuator/maintenance -H "Content-Type: application/json" -d '{"enabled": true}'
HTTP/1.1 200
Content-Length: 24
Content-Type: application/vnd.spring-boot.actuator.v3+json
{"maintenanceMode":true}
> curl -i http://localhost:8080/actuator/maintenance
HTTP/1.1 200
Content-Length: 24
Content-Type: application/vnd.spring-boot.actuator.v3+json
{"maintenanceMode":true}
2026-11-10T19:20:35.100+05:30 DEBUG 48452 --- [book-service] [nio-8080-exec-2] c.j.spring.actuator.BookController : looking up book 1
- Loggers - the package
com.javabrahman.spring.actuatorhas no level of its own and inheritsWARN. A POST withconfiguredLevelsets it toDEBUG; the answer is 204, and the next GET confirms it. The following request to/books/1now writes thelog.debug()line ofBookControllerto the log, as the second box shows. The application was not restarted, and the change is gone after the next restart. This is the quickest way to get more detail about a problem that only occurs in production. Logging in Spring BootClick to read tutorial: Logging in Spring Boot: SLF4J, Logback and Log Levels explains loggers and levels. - A custom endpoint -
MaintenanceEndpointis a bean with@Endpoint(id = "maintenance"). Its@ReadOperationmethod answers GET, and its@WriteOperationmethod answers POST, with the JSON propertyenabledbound to the method parameter of that name. A@DeleteOperationwould answer DELETE. Such an endpoint is technology-neutral: it is available over HTTP and JMX, and is covered by the same access and exposure settings as the built-in ones - it is reachable only becausemaintenanceis in the exposure list.
Securing Actuator
The examples exposed their endpoints without protection, which is acceptable on a developer's machine and nowhere else.env and configprops show the configuration, heapdump hands out the whole memory including every secret in it, and loggers and custom write operations change the running application. For production -
- Expose only what is used - typically
health,infoand the metrics endpoint of the monitoring system. Never*. - A separate port -
management.server.port=9001serves the Actuator endpoints on another port than the application. The public load balancer forwards only the application port, and the management port stays inside the network. - Authentication - with Spring SecurityClick to read tutorial: Configuring SecurityFilterChain in Spring Security, a security filter chain for the Actuator paths requires a role such as
ACTUATORfor everything excepthealth. Spring Boot provides the request matcherEndpointRequestfor this. - Health details for the authorized -
management.endpoint.health.show-details=when-authorizedgives anonymous callers only the status, and the components only to authenticated ones. - Values stay masked -
envandconfigpropsreplace all values with******unlessshow-valuesis changed. Leave it that way.
Summary
In this tutorial we added Spring Boot Actuator to a service. By default onlyhealth was reachable over HTTP, without details; an endpoint must be accessible and exposed to be called, and we exposed five. The health endpoint combined Spring Boot's indicators with a HealthIndicator of our own, and answered 503 when the warehouse was down, while the liveness group stayed up and the readiness group, which we had extended, went down. The info endpoint showed properties, the Java runtime and an InfoContributor. The metrics endpoint showed a counter we registered with Micrometer and the timer Spring Boot keeps for HTTP requests, filtered by tags. We changed a log level through the loggers endpoint without a restart, wrote a custom endpoint with @Endpoint, and listed how to keep Actuator out of public reach.Spring Boot Production Tutorials
Spring Modulith: Building a Modular MonolithClick to read tutorial: Spring Modulith: Building a Modular Monolith Spring Boot Startup and Memory Tuning: CDS and AOT CacheClick to read tutorial: Spring Boot Startup and Memory Tuning: CDS and AOT Cache Transactional Outbox Pattern with SpringClick to read tutorial: Transactional Outbox Pattern with Spring
Spring Modulith: Building a Modular MonolithClick to read tutorial: Spring Modulith: Building a Modular Monolith Spring Boot Startup and Memory Tuning: CDS and AOT CacheClick to read tutorial: Spring Boot Startup and Memory Tuning: CDS and AOT Cache Transactional Outbox Pattern with SpringClick to read tutorial: Transactional Outbox Pattern with Spring