
Distributed Tracing with Micrometer and OpenTelemetry
Introduction
In a single application a slow or failed request leaves its story in one log file and one stack trace. In a system of microservices one click may pass through a gateway and five services, each with its own log, each handling hundreds of other requests at the same moment. Which lines in which logs belong to that one click, and where did its three seconds go? Distributed tracing answers this by giving every incoming request an id that travels with it from service to service. Spring Boot does this with Micrometer Tracing, and with OpenTelemetry as the standard underneath. This tutorial adds tracing to two services, follows one request through both logs, looks at the header that carries the trace between them, prints the spans that would go to a tracing backend, and adds a span of its own. The code runs on Spring Boot 4.1.2 with Micrometer Tracing 1.7.2 and OpenTelemetry 1.62.0.Traces and spans
Two terms carry the whole idea -- A trace is the complete journey of one request through the system. It has a trace id, created by the first service that sees the request and passed along to every other.
- A span is one step of that journey: handling an HTTP request, making an HTTP call, running a query. A span has its own span id, the id of its parent span, a name, a start time and a duration.
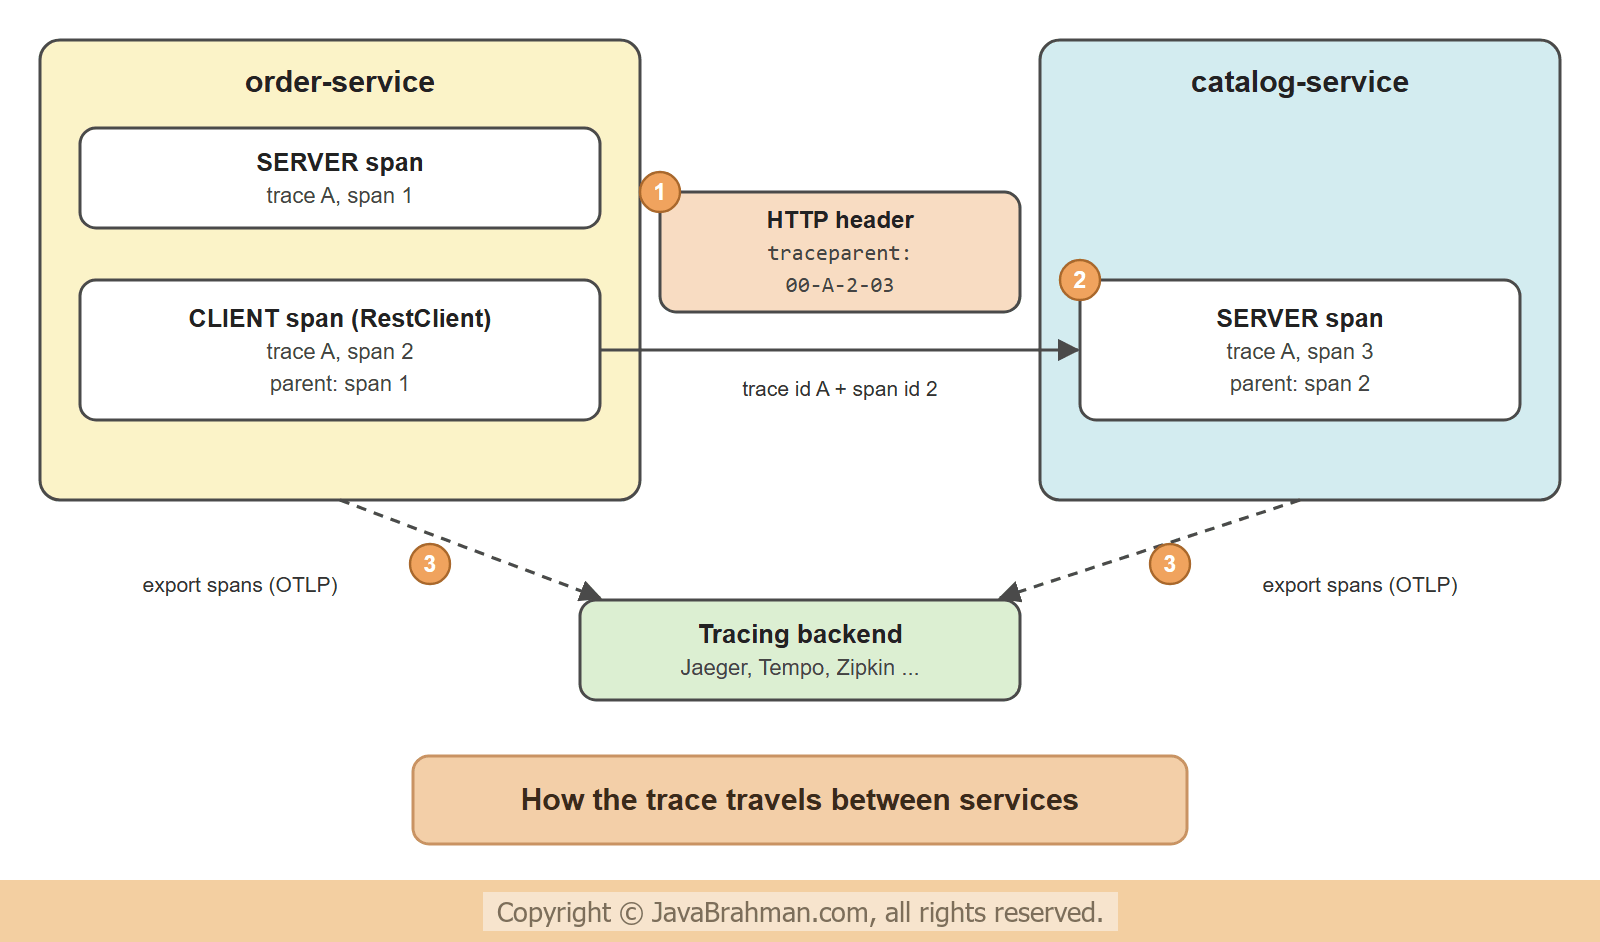
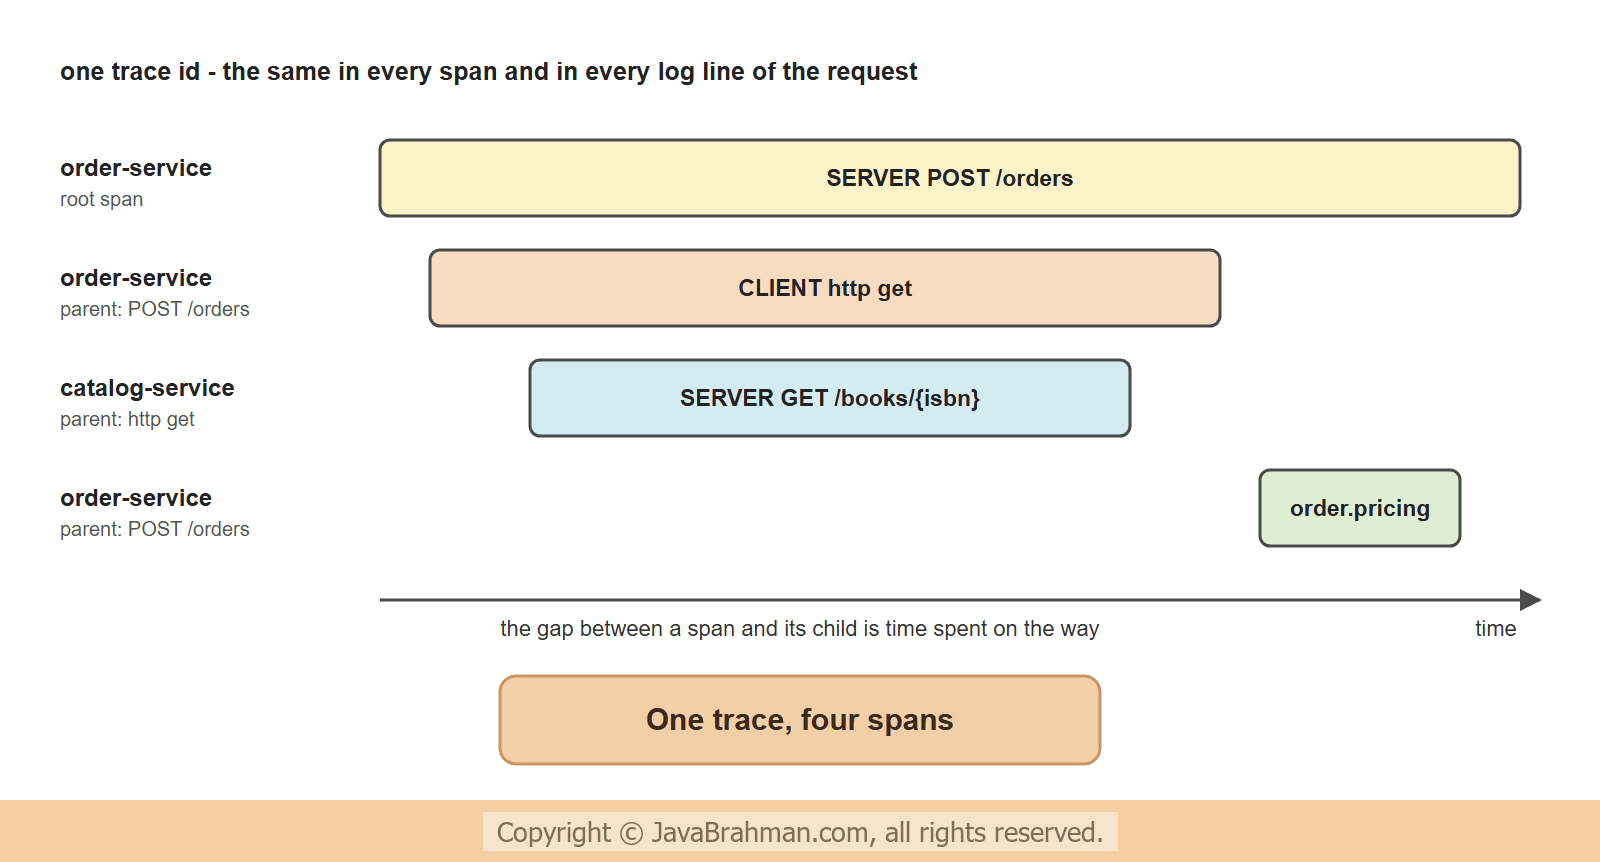 When a service calls another, it sends the trace id and its current span id along in an HTTP header. The called service continues the same trace and makes the sender's span the parent of its own. This is context propagation.
Micrometer and OpenTelemetry
Three names appear in this area, and they are layers, not rivals -- Micrometer Observation is the API that Spring's own code is instrumented with. Spring MVC, WebFlux,
RestClient,JdbcClientand others report "an HTTP request was handled" as an observation, from which both a metric and a span are made. - Micrometer Tracing turns observations into spans and puts the ids into the logging context. It is a facade over a tracer library.
- OpenTelemetry is the vendor-neutral standard: the tracer behind the facade, the format of the propagation header (W3C Trace Context), and OTLP, the protocol in which spans are sent to a backend such as Jaeger, Grafana Tempo or Zipkin, or to a commercial service.
pom.xml (extract) - in both services
<dependency>
  <groupId>org.springframework.boot</groupId>
  <artifactId>spring-boot-starter-opentelemetry</artifactId>
</dependency>
Two services with tracing
The services are the order service and the catalog service of the earlier tutorials in this module. Their configuration differs only in name and port -order-service: src/main/resources/application.properties
spring.application.name=order-service
server.port=8080
catalog.url=http://localhost:8081

# trace every request (the default is 0.1 - one request in ten)
management.tracing.sampling.probability=1.0
# for this demonstration: hand finished spans to the exporter every second (default 5s)
management.opentelemetry.tracing.export.schedule-delay=1s
logging.level.com.javabrahman=INFO
catalog-service: src/main/resources/application.properties
spring.application.name=catalog-service
server.port=8081

management.tracing.sampling.probability=1.0
management.opentelemetry.tracing.export.schedule-delay=1s
logging.level.com.javabrahman=INFOcatalog-service: src/main/java/.../catalog/CatalogApp.java
//CatalogApp.java
package com.javabrahman.cloud.tracing.catalog;

import com.javabrahman.cloud.tracing.shared.ConsoleSpanExporter;
import org.slf4j.Logger;
import org.slf4j.LoggerFactory;
import org.springframework.boot.SpringApplication;
import org.springframework.boot.autoconfigure.SpringBootApplication;
import org.springframework.context.annotation.Import;
import org.springframework.web.bind.annotation.GetMapping;
import org.springframework.web.bind.annotation.PathVariable;
import org.springframework.web.bind.annotation.RequestHeader;
import org.springframework.web.bind.annotation.RestController;

@SpringBootApplication
@Import(ConsoleSpanExporter.class)
@RestController
public class CatalogApp {

  private static final Logger log = LoggerFactory.getLogger(CatalogApp.class);

  record Book(String isbn, String title, int price) {}

  @GetMapping("/books/{isbn}")
  Book book(@PathVariable String isbn, @RequestHeader("traceparent") String traceparent) {
    log.info("Looking up book {} - traceparent header: {}", isbn, traceparent);
    return new Book(isbn, "Effective Java", 450);
  }

  public static void main(String[] args) {
    SpringApplication.run(CatalogApp.class, args);
  }
}RestClient.Builder that Spring Boot provides. That builder is instrumented; a client made with RestClient.create() sends no tracing header and the trace ends at this service -
order-service: src/main/java/.../order/OrderApp.java
//OrderApp.java
package com.javabrahman.cloud.tracing.order;

import com.javabrahman.cloud.tracing.shared.ConsoleSpanExporter;
import io.micrometer.observation.Observation;
import io.micrometer.observation.ObservationRegistry;
import org.slf4j.Logger;
import org.slf4j.LoggerFactory;
import org.springframework.beans.factory.annotation.Value;
import org.springframework.boot.SpringApplication;
import org.springframework.boot.autoconfigure.SpringBootApplication;
import org.springframework.context.annotation.Import;
import org.springframework.web.bind.annotation.PostMapping;
import org.springframework.web.bind.annotation.RequestBody;
import org.springframework.web.bind.annotation.RestController;
import org.springframework.web.client.RestClient;

@SpringBootApplication
@Import(ConsoleSpanExporter.class)
@RestController
public class OrderApp {

  private static final Logger log = LoggerFactory.getLogger(OrderApp.class);

  record OrderRequest(String isbn, int quantity) {}
  record Book(String isbn, String title, int price) {}
  record Order(String title, int quantity, int total) {}

  private final RestClient catalog;
  private final ObservationRegistry observations;

  OrderApp(RestClient.Builder builder, @Value("${catalog.url}") String catalogUrl, ObservationRegistry observations) {
    this.catalog = builder.baseUrl(catalogUrl).build();
    this.observations = observations;
  }

  @PostMapping("/orders")
  Order place(@RequestBody OrderRequest request) {
    log.info("Placing an order for {} x {}", request.quantity(), request.isbn());
    Book book = catalog.get().uri("/books/{isbn}", request.isbn()).retrieve().body(Book.class);

    // a span of our own around a piece of business logic
    int total = Observation.createNotStarted("order.pricing", observations)
        .lowCardinalityKeyValue("currency", "INR")
        .observe(() -> priceWithDiscount(book.price(), request.quantity()));

    log.info("Order total is {}", total);
    return new Order(book.title(), request.quantity(), total);
  }

  private int priceWithDiscount(int price, int quantity) {
    log.info("Pricing {} copies", quantity);
    int total = price * quantity;
    return quantity >= 3 ? total * 90 / 100 : total;
  }

  public static void main(String[] args) {
    SpringApplication.run(OrderApp.class, args);
  }
}Observation around the pricing, which is optional and explained below.
An exporter that prints the spans
Finished spans are handed to a span exporter, which normally sends them to a tracing backend. No backend is used in this tutorial. To see exactly what a backend would receive, both services register this small exporter, which prints each span on the console; Spring Boot picks up anySpanExporter bean -
ConsoleSpanExporter.java - the same class in both services
//ConsoleSpanExporter.java
package com.javabrahman.cloud.tracing.shared;

import io.opentelemetry.sdk.common.CompletableResultCode;
import io.opentelemetry.sdk.trace.data.SpanData;
import io.opentelemetry.sdk.trace.export.SpanExporter;
import java.util.Collection;
import org.springframework.stereotype.Component;

@Component
public class ConsoleSpanExporter implements SpanExporter {

  @Override
  public CompletableResultCode export(Collection<SpanData> spans) {
    for (SpanData span : spans) {
      String parent = span.getParentSpanContext().isValid() ? span.getParentSpanId() : "none";
      long micros = (span.getEndEpochNanos() - span.getStartEpochNanos()) / 1_000;
      System.out.printf("SPAN %-8s %-22s trace=%s span=%s parent=%s %d us%n",
          span.getKind(), span.getName(), span.getTraceId(), span.getSpanId(), parent, micros);
    }
    return CompletableResultCode.ofSuccess();
  }

  @Override
  public CompletableResultCode flush() {
    return CompletableResultCode.ofSuccess();
  }

  @Override
  public CompletableResultCode shutdown() {
    return CompletableResultCode.ofSuccess();
  }
}
One request, two logs
Both services are started and one order is placed - OUTPUT of placing an order> curl -i -X POST http://localhost:8080/orders -H "Content-Type: application/json" -d '{"isbn":"978-1","quantity":3}'
HTTP/1.1 200
Content-Length: 52
Content-Type: application/json
{"title":"Effective Java","quantity":3,"total":1215}
2026-11-10T10:53:45.181+05:30  INFO 44320 --- [order-service] [nio-8080-exec-2] [5b79b82308fd46f13a9b2b3fcf1cc8b2-feca877e844d6af8] c.j.cloud.tracing.order.OrderApp         : Placing an order for 3 x 978-1
2026-11-10T10:53:46.079+05:30  INFO 44320 --- [order-service] [nio-8080-exec-2] [5b79b82308fd46f13a9b2b3fcf1cc8b2-c5b45ca986283bbf] c.j.cloud.tracing.order.OrderApp         : Pricing 3 copies
2026-11-10T10:53:46.082+05:30  INFO 44320 --- [order-service] [nio-8080-exec-2] [5b79b82308fd46f13a9b2b3fcf1cc8b2-feca877e844d6af8] c.j.cloud.tracing.order.OrderApp         : Order total is 1215
2026-11-10T10:53:45.776+05:30 INFO 27956 --- [catalog-service] [nio-8081-exec-2] [5b79b82308fd46f13a9b2b3fcf1cc8b2-2a6fc0b2220ede47] c.j.cloud.tracing.catalog.CatalogApp : Looking up book 978-1 - traceparent header: 00-5b79b82308fd46f13a9b2b3fcf1cc8b2-faff3cbe9e24edfc-03
- With tracing on the classpath, Spring Boot adds a bracket of the form
[traceId-spanId]to every log line, after the application name and the thread. - The trace id, the 32 characters before the hyphen, is the same in all four lines, across two processes with different process ids. Searching the logs of all services for this one value finds everything that happened for this request.
- In the order service the first and third lines carry the same span id: that of the span for handling
POST /orders. The line "Pricing 3 copies" in between carries another, because it was logged inside the custom span. - The catalog service's line has the same trace id and a span id of its own.
- The
traceparentheader that the catalog service received has four parts separated by hyphens: a version (00), the trace id, the id of the calling span, and flags, in which the lowest bit says that this trace is sampled. This is the W3C Trace Context format, understood by tracing libraries in every language, so the chain also holds when the next service is not written with Spring. - The span id in the header appears in no log line of the order service. It belongs to the span that
RestClientcreated for the outgoing call, and nothing was logged while that call was in progress. It shows up in the next output.
The spans
A second or so after the request, the exporters printed the finished spans. Again the order service first - OUTPUT of the span exporter in the order serviceSPAN CLIENT http get trace=5b79b82308fd46f13a9b2b3fcf1cc8b2 span=faff3cbe9e24edfc parent=feca877e844d6af8 833334 us SPAN INTERNAL order.pricing trace=5b79b82308fd46f13a9b2b3fcf1cc8b2 span=c5b45ca986283bbf parent=feca877e844d6af8 5514 us SPAN SERVER http post /orders trace=5b79b82308fd46f13a9b2b3fcf1cc8b2 span=feca877e844d6af8 parent=none 1324269 us
SPAN SERVER http get /books/{isbn} trace=5b79b82308fd46f13a9b2b3fcf1cc8b2 span=2a6fc0b2220ede47 parent=faff3cbe9e24edfc 340611 us
- Each line is one span: its kind, its name, the trace id, its own id, its parent's id and its duration in microseconds. A span is exported when it ends, so the span that started first is printed last.
- The order service produced three spans.
http post /ordersof kindSERVERhas no parent: it is the root of the trace. TheCLIENTspanhttp getfor the outgoing call and theINTERNALspanorder.pricingboth name the root as their parent. - The catalog service produced one
SERVERspan, and its parent is theCLIENTspan of the order service - the id that arrived in thetraceparentheader. This link across the two processes is what joins the four spans into one tree. - Span names use the route pattern,
/books/{isbn}, and not the actual path, so that all requests to one endpoint are grouped together. - The durations nest: the root span covers the whole request, the client span most of it, and the catalog's server span is shorter than the client span around it. The difference between those two is time spent outside the catalog's code - connection setup and the network. A tracing backend draws exactly this as a timeline.
Spans of your own
Spring creates spans for what it knows: HTTP requests in and out, and with the right starters also database calls and messages. A slow step inside your own code is invisible unless it gets a span. The order service wrapped its pricing in an Observation -Observation.createNotStarted("order.pricing", registry)names the observation, andobserve(...)runs the code inside it: started before, stopped after, and marked as failed if the code throws.- One observation gives both a span in the trace and a timer metric of the same name. That is the reason to use the Observation API and not the tracer directly.
lowCardinalityKeyValueadds a tag with few possible values, safe for metrics.highCardinalityKeyValueis for values such as an order id, which go to the span only.- The annotation
@Observedon a method does the same declaratively. It needs the AspectJ starter andmanagement.observations.annotations.enabled=true.
order.pricing span - and the exporter shows that span as a child of the request's server span.
Sending traces to a backend
In production the spans go to a backend that stores them and draws the timeline. With the starter in place this needs one property; the address below is the usual one of an OpenTelemetry Collector or Jaeger on the same machine. It was not run for this tutorial -application.properties - exporting over OTLP (not run here)
management.opentelemetry.tracing.export.otlp.endpoint=http://localhost:4318/v1/traces
management.tracing.sampling.probability=0.1- Sampling - tracing every request of a busy system costs storage and some time. The default records one request in ten. The decision is made once, by the first service, and travels in the header, so a trace is recorded either in all services or in none.
- Every hop must take part - a service or gateway that does not forward the header cuts the trace in two. Spring Cloud GatewayClick to read tutorial: API Gateway with Spring Cloud Gateway forwards and joins traces when the same starter is added to it.
- Threads and messages - the trace context lives in the current thread. It follows a
RestClientorWebClientcall by itself; work handed to another thread or sent through a message broker needs the instrumented executors and templates that Spring provides, or the trace stops there. - Logs - keep the trace id in every log line, as above. A log search for one trace id then shows the lines of all services for one request, even without a tracing backend.
Summary
In this tutorial we addedspring-boot-starter-opentelemetry to two services and wrote no tracing code for the basics. One request produced log lines in both services with the same trace id; the traceparent header carried that id, and the calling span's id, from the order service to the catalog service. A small exporter printed the spans: a server span per service, a client span for the call between them, and a custom span from the Observation API, linked into one tree by their parent ids. Exporting to a real backend is one OTLP property away. Tracing shows how services talk to each other; the next tutorial compares the ways they can: REST, messaging and gRPCClick to read tutorial: Inter-Service Communication: REST vs Messaging vs gRPC.Spring Cloud and Microservices Tutorials
Circuit Breakers and Retries with Resilience4jClick to read tutorial: Circuit Breakers and Retries with Resilience4j Inter-Service Communication: REST vs Messaging vs gRPCClick to read tutorial: Inter-Service Communication: REST vs Messaging vs gRPC Microservices with Spring: When and WhyClick to read tutorial: Microservices with Spring: When and Why Centralized Configuration with Spring Cloud ConfigClick to read tutorial: Centralized Configuration with Spring Cloud Config Service Discovery: Eureka vs KubernetesClick to read tutorial: Service Discovery: Eureka vs Kubernetes API Gateway with Spring Cloud GatewayClick to read tutorial: API Gateway with Spring Cloud Gateway Saga Pattern for Distributed TransactionsClick to read tutorial: Saga Pattern for Distributed Transactions
Circuit Breakers and Retries with Resilience4jClick to read tutorial: Circuit Breakers and Retries with Resilience4j Inter-Service Communication: REST vs Messaging vs gRPCClick to read tutorial: Inter-Service Communication: REST vs Messaging vs gRPC Microservices with Spring: When and WhyClick to read tutorial: Microservices with Spring: When and Why Centralized Configuration with Spring Cloud ConfigClick to read tutorial: Centralized Configuration with Spring Cloud Config Service Discovery: Eureka vs KubernetesClick to read tutorial: Service Discovery: Eureka vs Kubernetes API Gateway with Spring Cloud GatewayClick to read tutorial: API Gateway with Spring Cloud Gateway Saga Pattern for Distributed TransactionsClick to read tutorial: Saga Pattern for Distributed Transactions